I. Overview
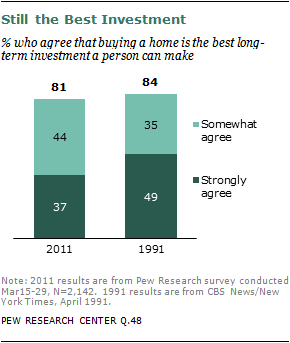
The five-year swoon in home prices has done little to shake the confidence of the American public in the investment value of homeownership. Fully eight-in-ten (81%) adults agree that buying a home is the best long-term investment a person can make, according a nationwide Pew Research Center survey of 2,142 adults conducted from March 15 to March 29, 2011.
There has been some falloff in the intensity of the public’s faith. Today, 37% “strongly agree” while 44% “somewhat agree” that homeownership is the best investment a person can make. When this same question was asked two decades ago in a CBS News/New York Times survey, 49% “strongly agreed” and 35% “somewhat agreed.”
Even so, confidence at any level these days is notable, given that the housing market is mired in the longest and deepest decline in modern American history. Home prices are down by 31% from their pre-recession peak in July 2006, according to the S&P/Case-Shiller Home Price index.1 After a pause last year, prices fell again in the first quarter of 2011.
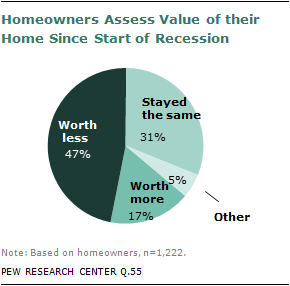
Homeowners are not blind to what has happened to home prices, nor are they expecting a speedy recovery. Among the 1,222 homeowners in the nationwide Pew Research telephone survey, about half (47%) say their home is worth less now than before the recession began, and 31% say its value has stayed the same. Just 17% say their home is worth more.
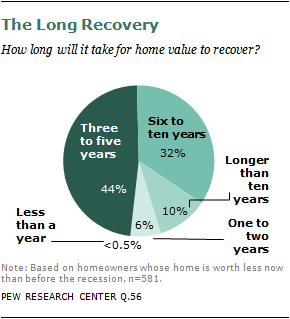
Of those who say their home has lost value, 86% say they expect it to take at least three years for values to recover to pre-recession levels; 42% say it will take at least six years; and 10% say it will take more than 10 years.
Still, fully 82% of homeowners who say their home is worth less now than before the recession began either strongly (37%) or somewhat (45%) agree that homeownership is the best long-term investment a person can make. Among homeowners whose home increased in value during the recession, this confidence is even more pronounced. Half (49%) strongly and 41% somewhat agree with this view.
Overall, homeowners are more positive than renters about the financial wisdom of owning a home; 41% of homeowners strongly agree that this is the best long-term investment a person can make, compared with just 31% of renters. (The survey sample included 57% of respondents who own a home and 30% who are renters; the remainder has other arrangements, such as living with family members.)
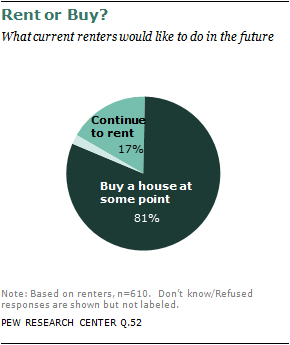
But renters are hardly immune to the allure of homeownership, even in the face of the five-year decline in prices. Asked if they rent out of choice or because they cannot afford to buy a home, just 24% say they rent out of choice. And when renters are asked if they would like to continue to rent or if they would prefer one day to buy a home, 81% say they would like to buy.
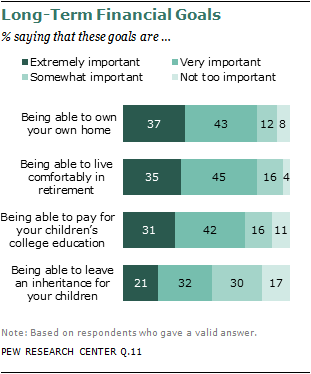
More evidence of the durability of Americans’ belief in homeownership comes from a question in which respondents are asked to assess the importance of four long-term financial goals. Homeownership and “being able to live comfortably in retirement” are rated the highest; each is seen as being extremely or very important by 80% of respondents. Nearly as many (73%) say the same about being able to pay for their children’s college education, and about half (53%) say the same about being able to leave an inheritance for their children. (These percentages do not include those who volunteered a “does not apply” response).
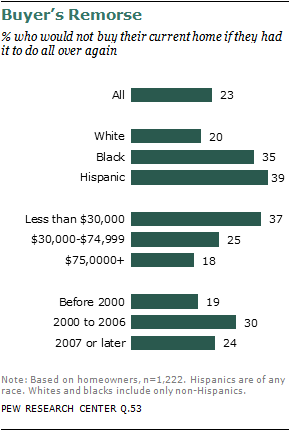
The Pew Research survey did find that nearly a quarter (23%) of all homeowners say that if they had it to do all over again, they would not buy their current home. But six-in-ten who express these pangs of “buyer’s remorse” cite complaints about the home itself (43%) or the location (17%). Just 31% cite financial factors. Of these, about half (16%) say their home has either lost value or failed to rise in value; others point to changes in the economy or their own financial circumstances.
The Bubble and its Aftereffects
The collapse in home prices since 2006 came on the heels of a 10-year period during which they more than doubled, rising by an unprecedented 137% from 1996 to 2006.2 However, much of this run-up was a classic market “bubble,” fueled by excesses and fraud in the mortgage industry. When the bubble burst, financial markets melted down and the Great Recession (December 2007-June 2009) began.
During its dramatic ascent, the bubble generated big changes in consumer behavior. The home is the biggest asset for most Americans, and the run-up in home prices created what economists call a “wealth effect” that led to surges in consumer spending and borrowing that proved unsustainable. Once the bubble burst, those tendencies were curtailed.
Whatever other impacts it has had on the public and the economy, the bubble may partly explain the resilience of Americans’ faith in homeownership as an investment. Despite the sharp market declines of the past five years, the typical homeowner who has owned a home since 2002 or before still has seen its value rise (see charts on page 6). Not surprisingly, the Pew Research survey finds that the longer people have owned their home, the more likely they are to believe in the investment value of homeownership.
The big rise in home prices in the late 1990s and early 2000s may also explain this survey finding: Even with the five-year swoon in home prices, two-thirds of the public say that homeownership is not affordable to most young adults in their 20s and 30s. (This judgment may also reflect the public’s recognition of the high current levels of unemployment among young adults.)3
Stock Market versus Housing Market
A home is more than a financial investment. It’s a place to raise a family, an anchor of community life, a haven for retirement, an emblem of the American dream. When survey respondents say it’s the best long-term investment a person can make, it’s likely they are making evaluations that go beyond dollars and cents.
Nevertheless, dollars and cents matter. For most Americans, their biggest investments are their homes and their stock holdings, with the latter typically in the form of a 401(k) plan or some other retirement account.
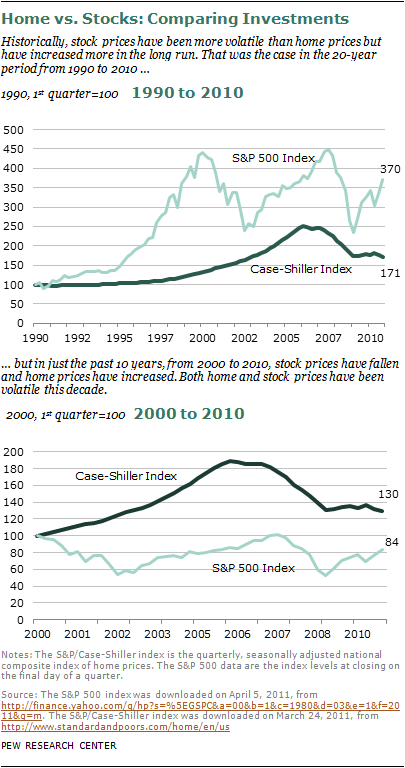
How have these two investments stacked up against one another in recent times? Through most of modern economic history, the stock market has delivered the higher returns (but also more volatility). As the top chart shows, a person who invested $100 in a broad stock market index at the start of 1990 would have $370 at the end of 2010 (along with a knot in his or her stomach from the roller-coaster ride through multiple peaks and valleys). By contrast, a person who invested $100 in a home in 1990 would have seen the value of that investment climb to $171—in other words, less than half as high.
But if those two $100 investments had been made in 2000, the story would have been reversed. The housing investment would be worth $130 at the end of 2010, while the stock investment would be worth just $84. To complicate matters still further, if the starting point were mid-decade—2005—the story reverses yet again. Since then, the stock index is up by 7%, while the housing price index is down by 23%.
Bottom line: Calculating the relative value of these two long-term investment options has been an unusually complicated and ever-changing exercise in the past two decades.
Demographic Patterns
On many of the questions posed in the survey, answers vary according to respondents’ income level; region of the country; race and ethnicity; age; and the duration of homeownership. Here is a rundown of the key patterns:
Income
The survey finds that the recession-era decline in home values has hit those with higher annual household incomes harder than those with lower annual incomes. Some 57% of homeowners with incomes of $100,000 or more say their homes have lost value since the recession began, compared with just 37% of those with incomes below $30,000 and 49% of those with incomes of $30,000 to $75,000.
Nevertheless, those in higher and middle-income brackets have fewer regrets about buying their home than do those in lower brackets. Fully eight-in-ten of those with incomes of $75,000 and above say that if they had it to do all over again, they would buy their current home; just 62% of homeowners with incomes below $30,000 say the same.
Region
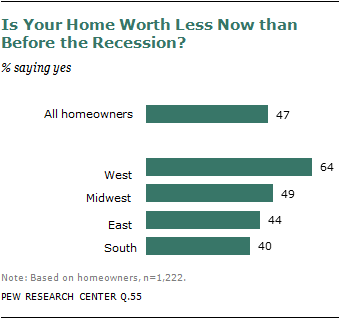
Homeowners in the West are more likely than those in other regions to have seen their homes lose value during the recession. Some 64% of Western homeowners say this, compared with 49% of those in the Midwest, 44% of those in the East and 40% of those in the South.
Among those whose homes have lost value, Westerners and Midwesterners are more pessimistic about a speedy recovery than those living in the South and East. Roughly half (46% of Westerners and 51% of Midwesterners) say they think it will take at least six years for their home’s value to return to pre-recession levels. Among Southerners whose homes have lost value, just 39% expect it will take six or more years to recover, and among Easterners, just 29% say this.
Western homeowners are also more likely to report being “underwater”—meaning the current market value of their home is below what they owe on their mortgage. Some 22% of Western homeowners say this, compared with 13% of those in the South and Midwest and 9% of those in the East.
Age
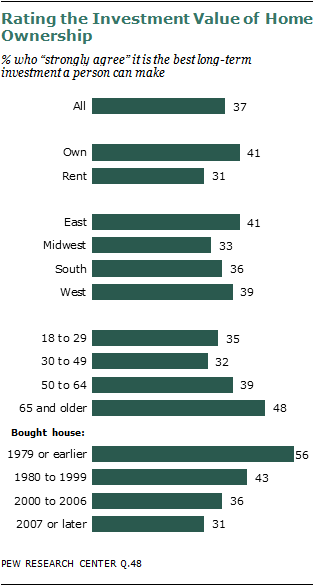
Adults ages 65 and older are more sold on the investment value of homeownership than any other age group. Some 48% of this older cohort agree that homeownership is the best long-term investment a person can make, compared with 39% of those ages 50 to 64; 32% of those ages 30 to 49; and 35% of those ages 18 to 29.
Adults in the older age group are more likely to have owned their home a long time and to have paid off their mortgage. As a result, they’re less exposed to being underwater because of the sharp decline in housing prices. The Pew Research survey finds that just 5% of older homeowners report being in this situation, compared with 13% of homeowners ages 50 to 64; 20% of homeowners ages 30 to 49; and 23% of homeowners ages 18 to 29.
Race and Ethnicity
Hispanic and black homeowners have higher levels of buyer’s remorse than do whites. Asked whether, if they had it to do all over again, they would buy their current home, 39% of Hispanics and 35% of blacks say they would not, compared with just 20% of whites.
According to the Pew Research survey, 33% of Hispanic homeowners report being underwater, compared with 15% of blacks and 13% of whites.
Duration of Homeownership
The longer someone has owned a home, the more likely that person is to trumpet the financial wisdom of homeownership. Among homeowners who have been in their current home since 1979 or earlier, 56% strongly agree that homeownership is the best long-term investment a person can make. This share falls to 43% among those who bought their current home between 1980 and 1999; to 36% among those who bought their home between 2000 and 2006; and to 31% among those who have owned since 2007 or later.
The highest level of buyer’s remorse, however, is among homeowners who purchased their current home during the great run-up in prices, from 2000 to 2006. Some 30% of these homeowners say that, if they had it to do all over again, they would not buy their current home, compared with 19% of those who purchased their current home before 2000; and 24% of those who purchased their current home in 2007 or later.
About the Survey
Results for this survey are based on telephone interviews conducted with a nationally representative sample of 2,142 adults ages 18 and older living in the continental United States. A combination of landline and cellular random digit dial (RDD) samples was used to represent all adults in the continental United States who have access to either a landline or cellular telephone. A total of 1,052 interviews were completed with respondents contacted by landline telephone and 1,090 with those contacted on their cellular phone. In addition, oversamples of adults 18 to 34 were achieved. The data are weighted to produce a final sample that is representative of the general population of adults in the continental United States. Survey interviews were conducted under the direction of Princeton Survey Research Associates International, in English and Spanish. For more details, see Appendix.
- Interviews conducted March 15-29, 2011
- 2,142 interviews
- Margin of sampling error is plus or minus 2.7 percentage points for results based on the total sample and 3.6 percentage points for homeowners at the 95% confidence level.
Note on terminology: Whites include only non-Hispanic whites. Blacks include only non-Hispanic blacks. Hispanics are of any race.


