Birth rates in the United States began to decline in 2008 after rising to their highest level in two decades, and the decrease appears to be linked to the recession, according to a Pew Research Center analysis of state fertility and economic data.

This analysis is based on data from the 25 states for which final 2008 birth numbers are available. State-level indicators were used because the magnitude and timing of the recent economic decline varies from state to state, thus allowing a more nuanced analysis of links with fertility than is possible at the national level.
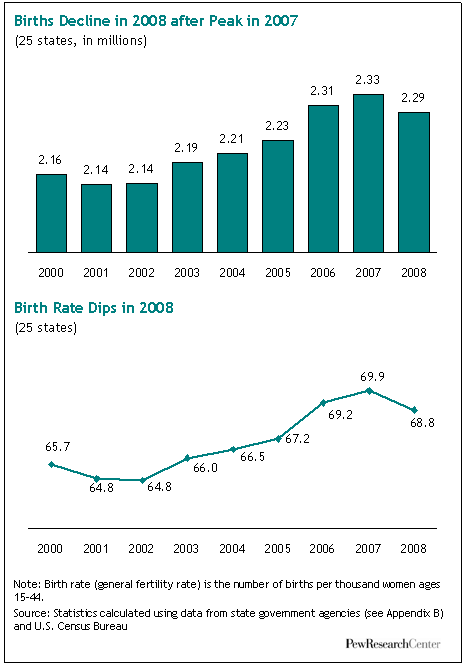
In 22 of these 25 states, the birth rate — the share of women of childbearing age who gave birth — declined or leveled off in 2008, compared with the previous year. In 20 of the 25 states, the number of births declined or leveled off from the previous year.
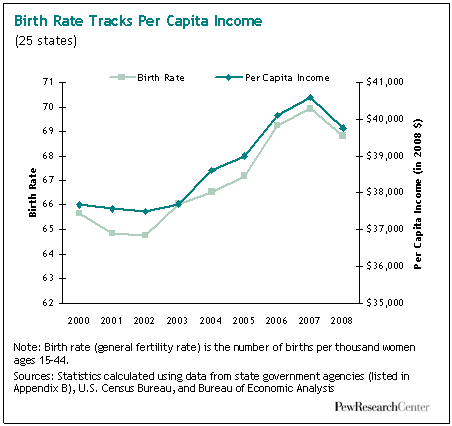
The analysis suggests that the falloff in fertility coincides with deteriorating economic conditions. There is a strong association between the magnitude of fertility change in 2008 across states and key economic indicators including changes in per capita income, housing prices and share of the working-age population that is employed across states.
The nation’s birth rate grew each year from 2003 to 2007, and has declined since then. As will be shown later in this report, the number of births also peaked in 2007 to a record level, dipped nearly 2% in 2008 and continued to decline in 2009, according to National Center for Health Statistics (NCHS) data. This analysis focuses on birth rate changes in 2008, the year after the national recession began. Research shows that past recessions are linked to fertility declines but that other factors also play a role.
State Birth Data Show Link with Economy

This analysis capitalizes on state-level differences in the magnitude and change over time of fertility and economic indicators to examine links between the two. It relies mainly on data from the 25 states that have finalized their own 2008 fertility figures.1 These states include slightly more than half the nation’s 2008 population of women of childbearing age (54%) and annual births (54%). Their total births and combined birth rate followed national trends earlier in the decade. In 2008, according to final data supplied by these states, they had a combined total of 2.29 million births, compared with 2.33 million in 2007. Their combined birth rate was 68.8 births per 1,000 women ages 15-44 in 2008, compared with 69.9 in 2007, a decline of 1.6%.
One test of the association between economic and fertility indicators is to examine whether states that experienced larger economic changes also experienced similar changes in fertility. By this measure, there is evidence of a link between fertility and some key economic indicators.
Strong associations were found between the magnitude of state-level birth rate change from 2007 to 2008 and the magnitude the previous year of per capita income change and housing price change. Strong associations also were found between the magnitude of state-level birth rate change from 2007 to 2008, and the previous year’s change in gross domestic product by state, as well as in first claims for unemployment benefits. Analysis also found a strong association between the magnitude of birth rate change from 2007-2008 and a state’s housing foreclosure rate in 2007.2 No correlation was found with change in state-level employment or unemployment rates.

Among the 25 states, Arizona’s birth rate declined more than 4% in 2008 compared with the previous year, the largest change of the 25. Its decline in per capita income in 2007 ranked second among those 25 states and its housing price change ranked sixth. Florida, which had the fourth-largest decline in birth rates among the 25 states in 2008, had a 0.5% decline in per capita income the previous year and a 2% foreclosure rate, both of which ranked worst among the this group of states.
At the other end of the scale, North Dakota was one of only five of the 25 states that had a gain in its fertility rate in 2008; its growth in per capita income growth was the largest among these states, and its 2007 foreclosure rate was the second lowest among the 25 states.
Economy and Fertility Chronology
Another test of whether economic indicators could be linked to fertility indicators is to examine how they relate to each other across time within each state. In all 22 states where the fertility rate leveled off or declined in 2008, economic conditions had begun to deteriorate within the two previous years, when many potential parents were deciding whether to have a child.
Economic conditions are described using per capita income growth and growth in the percent employed. In most states, both indicators leveled off or declined just prior to the decline in fertility, but in each state, at least one measure did. Specifically, the growth in per capita income leveled off or declined in 21 states (the exception being Michigan), and growth in the percent employed came to a halt in 21 states (the exception being Mississippi).
In California, for example, the birth rate declined in 2008 after having grown each year since 2003. In New Hampshire, the birth rate slipped in 2008 to its lowest level in the decade. In both states, the growth in per capita income and percent employed slowed by 2007.
Further support for a link between birth rates and the economy is an October 2009 Pew Research Center survey, which found that 14% of Americans ages 18-34 and 8% of those ages 35-44 say they postponed having a child because of the recession. Blacks (13%) were more likely than whites (5%) to say so. So were respondents with incomes of less than $25,000 (9%), compared with those with incomes of $75,000 or more (2%).
Patterns in the 25 States
In some states, the decline in births began earlier than 2008. Of the 20 states where the number of births declined or leveled off in 2008,3 four also had declines or leveling off in 2006 or 2007. In most of the states-13-the number of births had been growing for three years or more.
As noted above, birth rates declined or leveled off in all but three4 of the 25 states in 2008, compared with the previous year. In two of those three states (North Dakota and Washington), birth rates grew at a slower pace than they had in 2006.
National Birth Trends
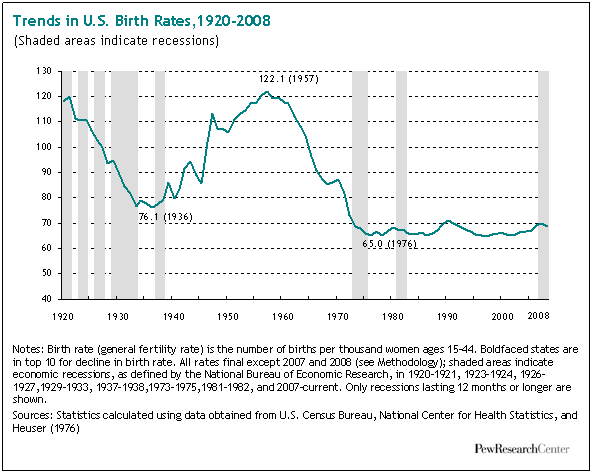
Nationally, birth rates have fluctuated within a modest range-about 65 to 70 births per 1,000 women of child-bearing age-since the mid-1970s. As the accompanying chart shows, that is far below the peak years of the post World War II baby boom, when rates rose to more than 100 births per 1,000 women ages 15-44.

Over the past decade, birth rate trends roughly mirrored the nation’s economic ups and downs. Birth rates dipped slightly in 2001 and 2002, then began growing again in 2003 before peaking in 2007. The birth rate in 2007 was the highest in nearly two decades. The rate declined modestly in 2008 and continued its decline during the first six month s of 2009, according to preliminary and provisional data from the National Center for Health Statistics (NCHS).
The number of births in 2007 — 4,317,119 — was the highest ever recorded in the United States, according to preliminary data from the NCHS. The number of births declined to 4,251,095 in 2008, according to preliminary NCHS figures. Provisional figures indicate births have continued to decline during the first six months of 2009, when they totaled 2,032,000, a dip of 63,000 from provisional data for the same period in 2008.
Research indicates that economic downturns are associated with fertility declines in developed nations, although the decrease usually is temporary. One prominent example is the Great Depression and series of recessions that preceded it, which intensified an existing trend toward declining birth rates. Birth rates dropped 26% between 1926 and 1936, diminishing to levels not seen again until the “baby bust” years of the 1970s.
However, the business cycle generally is thought to be only one of a number of forces influencing the fertility rate. Other factors that have been cited include attitudes toward working women, the relative rise in women’s wages compared with men’s wages and the availability of contraception, especially the growing use of the birth control pill in the 1960s.
Nationally, the most recent recession began in December 2007, but the housing and construction sectors weakened a year earlier. After rising by a record amount in 2004-2005, the median price of an existing home dropped by a record amount in 2005-2006. According to the National Association of Realtors, the median price of an existing home sold in October 2006 was $221,000, down a record 3.5% from October 2005.
Read the full report for more details.


